Maps are like campfires: everyone gathers around them because they allow people to understand complex issues at a glance, and find agreement about how to help the land. -Sonoma
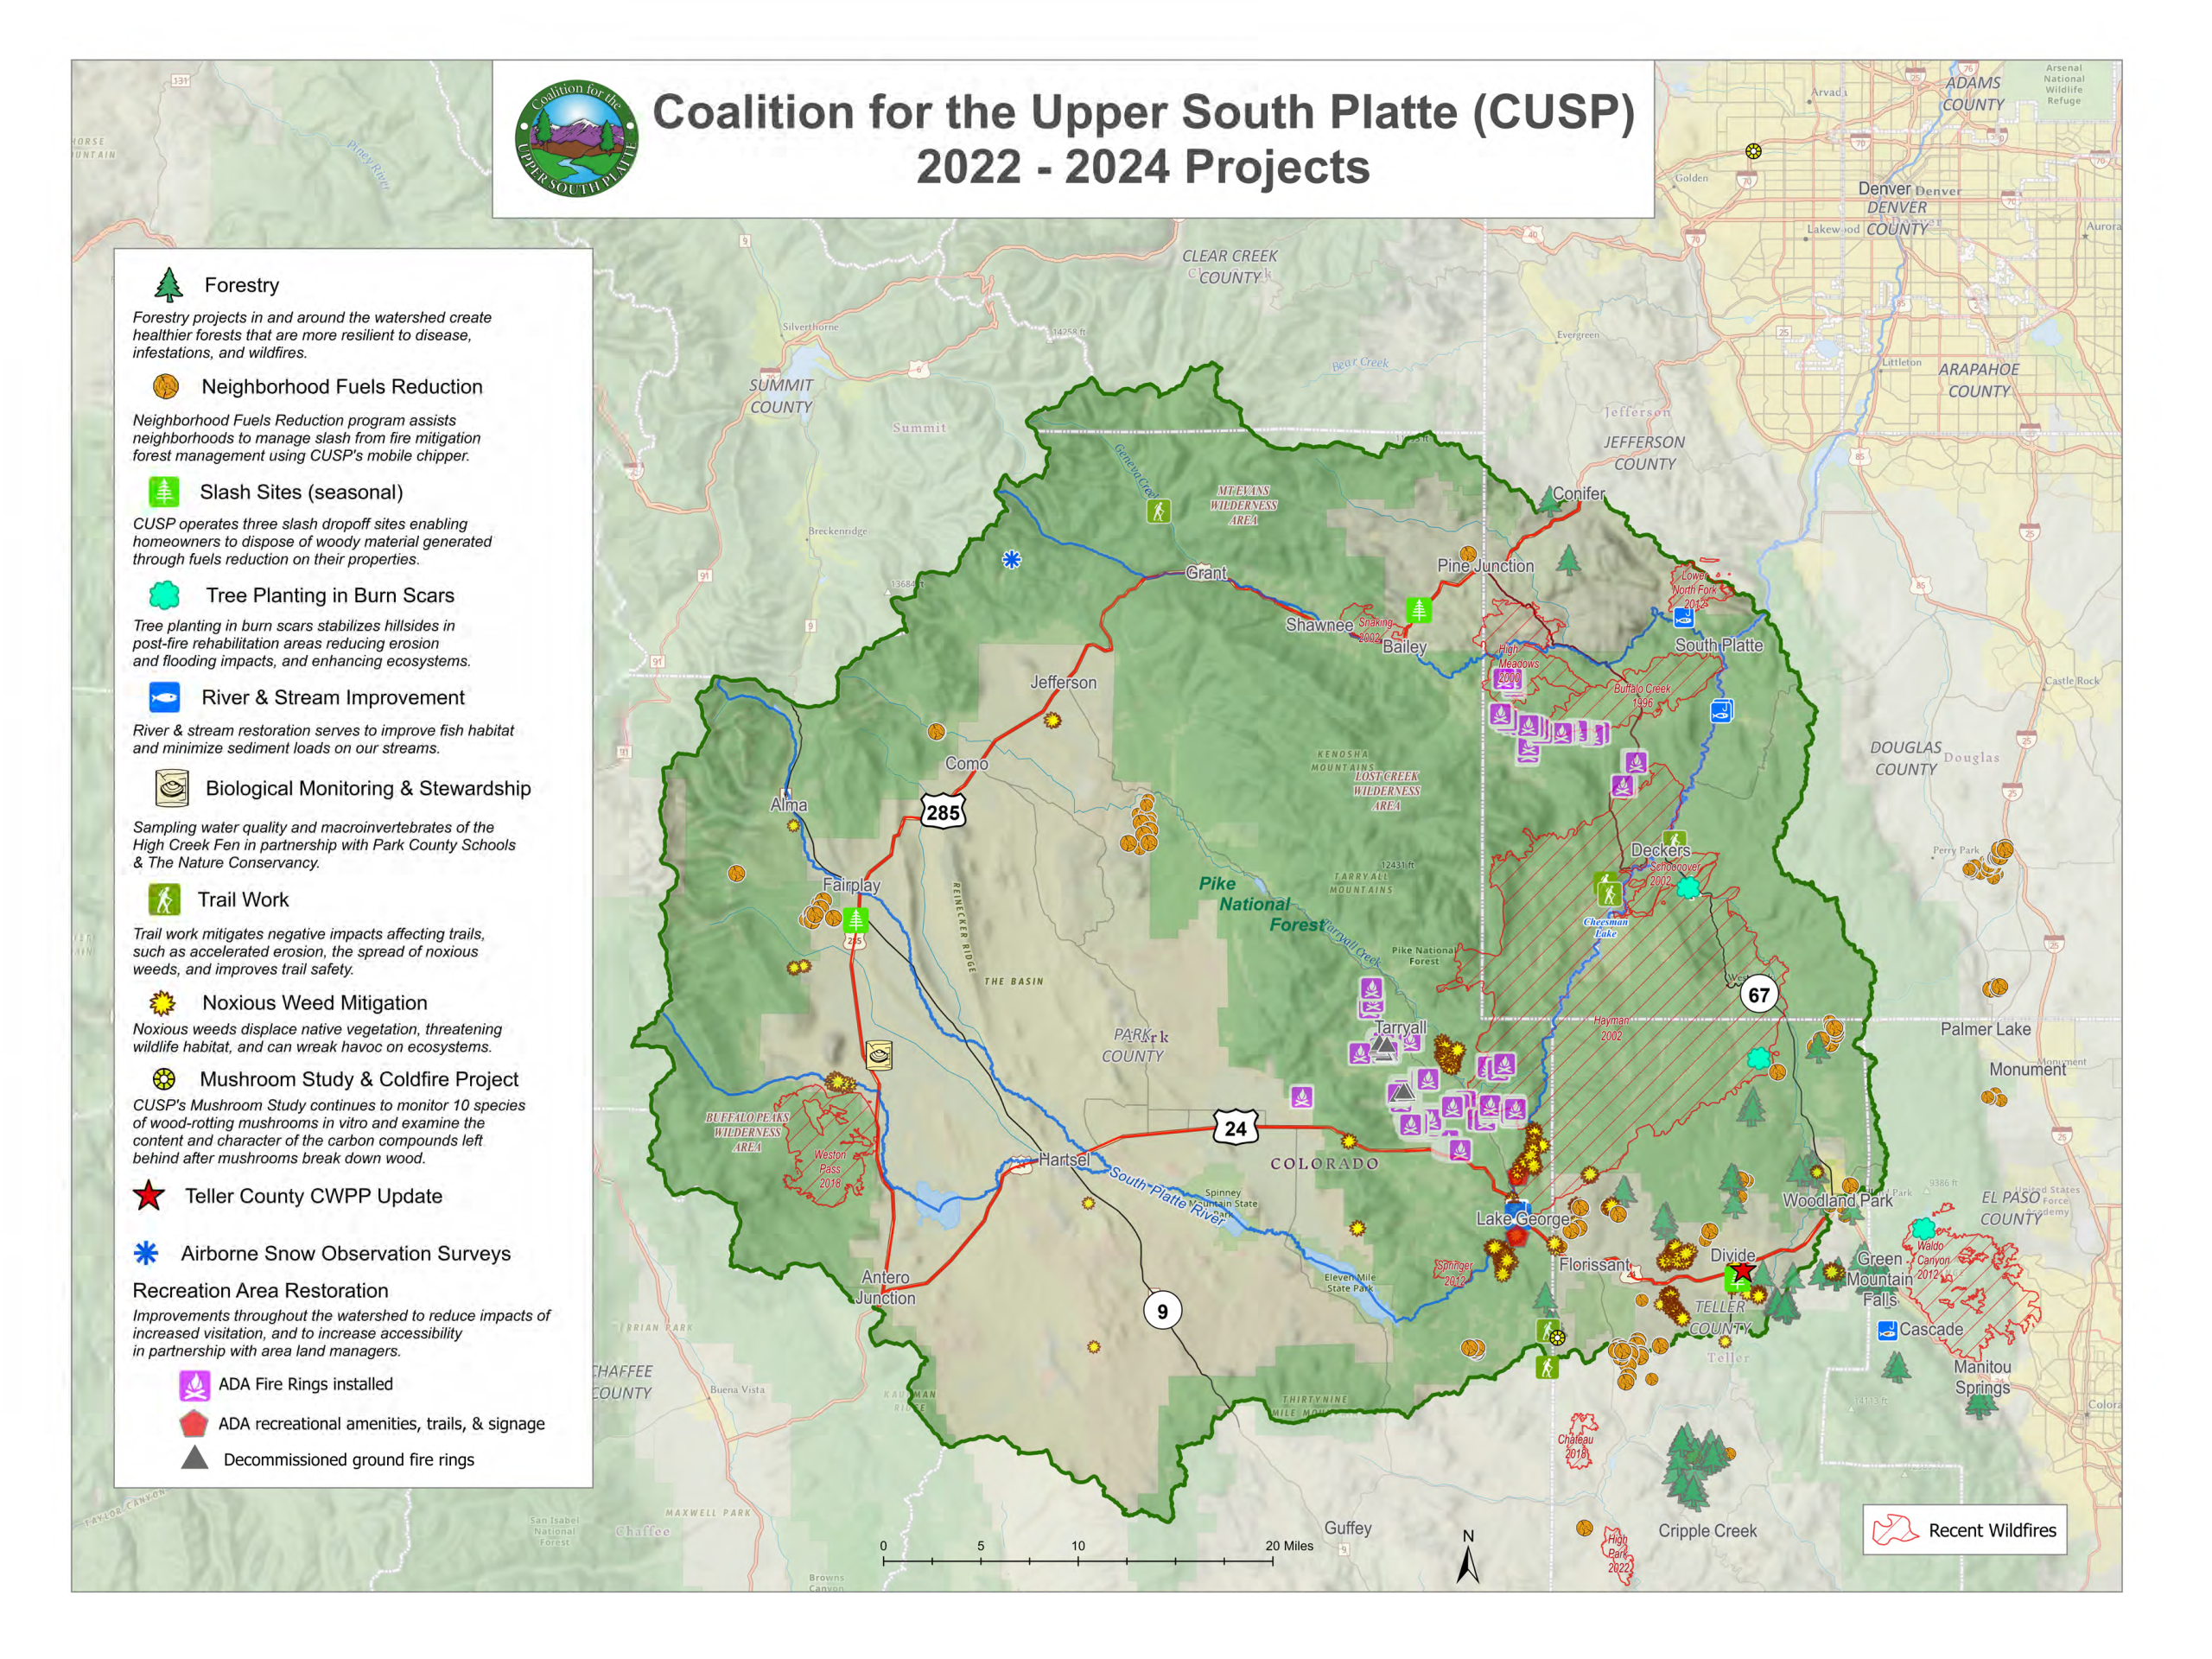
Maps are made up of boundaries created by people. These same maps can also reveal shared interests and issues that defy man-made boundaries. CUSP uses the visual power of maps to foster collaborative relationships and work across jurisdictional boundaries. We use maps to quickly and easily convey ideas that would take pages of text to explain, and in doing so help stakeholders move beyond boundaries to proactively prioritize work and build partnerships.
CUSP Geographic Information Systems (GIS) supports all aspects of our organization’s work, enabling CUSP to perform at the intersection of emergency response and community preparedness. Mapping is essential for planning projects, implementing programs, and collecting data to promote watershed health, enabling better understanding and decision making. Our GIS program supports forest health, water quality, wildfire suppression, emergency response, flood mitigation, emergency preparedness, river restoration, recreation, and education programs by:
- Collecting Data: We collect project data and other relevant watershed data using mobile collection systems and data sharing agreements with our partners from all levels of government, utility companies, consulting firms, and others. This data paints a picture of the health of the watershed and adds to the success of projects. Data is essential for strategically identifying needs on the ground and continually improving our programs.
- Generating Maps: Using the data we collect, we frequently create maps to support our work and the work of our partners. Maps include those for directions, grant proposals and reporting, project development and review, forestry work analysis, outreach, and invoices.
- Performing Spatial Analysis: Spatial analysis is used to inform numerous activities including Community Wildfire Protection Plan development and decision making, and assessments to determine replacement costs for values at risk that may be impacted by events such as wildfires or floods.
- Assessing Tools: We are continually assessing tools and software that fit, or may be customized to fit, our specialized needs.
Examples of our GIS work:
We have been able to grow our GIS program through the generous support of ESRI’s Nonprofit Organization Program and Google for Nonprofits Grants. We are also grateful to United Reprographic Supply Inc. Centennial for helping us maintain and operate our equipment.